Trends in alcohol-related mortality rates before, during, and after the COVID-19 pandemic
Identifying whether the increases in alcohol-related deaths observed during the COVID-19 pandemic have persisted, and for whom, can help target prevention and intervention efforts. This study examined differences in alcohol-related mortality rates by demographics across time, including the years before and after the pandemic.
Previous studies, however, often did not analyze differences in alcohol-related mortality rates by demographics, such as age, sex, race, and geographic location. It is also unclear whether the record high-rate increases observed during the pandemic have persisted or returned to pre-pandemic levels. Researchers in this study examined demographic differences in the number of deaths from alcohol across time, including trends during and after the pandemic. Such research can help identify which demographic groups are at the highest risk of alcohol-related death and whether particular groups continue to be affected by pandemic-related rate increases, which can help target prevention and intervention efforts towards these individuals.
HOW WAS THIS STUDY CONDUCTED?
The researchers in this study examined demographic differences in the number of fully attributable alcohol-related deaths in the United States between 1999 and 2024. Demographic differences that were investigated included age, sex, race, and geographic location.
Mortality data was obtained from the Centers for Disease Control and Prevention’s Wide-Ranging Online Data for Epidemiologic Research (CDC WONDER) database. Data was pulled for deaths of individuals from all 50 states in US and the District of Columbia of all ages between 1999 and 2024. The research team identified deaths attributable to alcohol using codes from the International Statistical Classification of Diseases and Related Health Problems, Tenth Revision (ICD-10). The codes included were related to alcoholic liver disease, alcohol poisoning, and mental and behavioral disorders due to the use of alcohol. Only alcohol-related deaths that were fully attributable to alcohol use were included because deaths that are partially linked to alcohol use may include other confounding factors that the researchers wanted to avoid.
Demographic data was also based on the data pulled from the CDC WONDER database. In this database, sex is treated as a binary variable (i.e., male and female) and the researchers accordingly adopted this classification in their analyses. A complicated process was used to determine the racial categorization, but ultimately the research team followed the categorization provided by the CDC WONDER database and extracted the racial information from death certificates. The following racial categories were used: American Indian and Alaskan Native, Asian and Pacific Islander, Black, Hispanic, and White. For age, the researchers used 10-year age groups, starting at age 15 and ending at age 75 and older. Data on race was only available from 1999-2020, while data for all other demographic variables was available from 1999-2024. Thus, alcohol-related mortality was not examined after the COVID-19 pandemic, which began in March 2020.
For the analyses, the researchers used population data to calculate crude mortality rates, stratified by sex, age, race, and 3 cause-of-death categories: alcoholic liver disease, mental and behavioral disorders due to alcohol use, and alcohol poisoning. Crude rates were calculated by dividing the number of fatalities in each year or month by the associated total population in that given year or month, multiplied by 100,000 – thus, resulting in number of deaths per 100,000 people. Trends in alcohol-related mortality rates over time were analyzed.
WHAT DID THIS STUDY FIND?
Alcohol-related yearly mortality rates increased nationwide – men, middle-aged adults, and American Indian/Alaska Natives had the largest overall rates
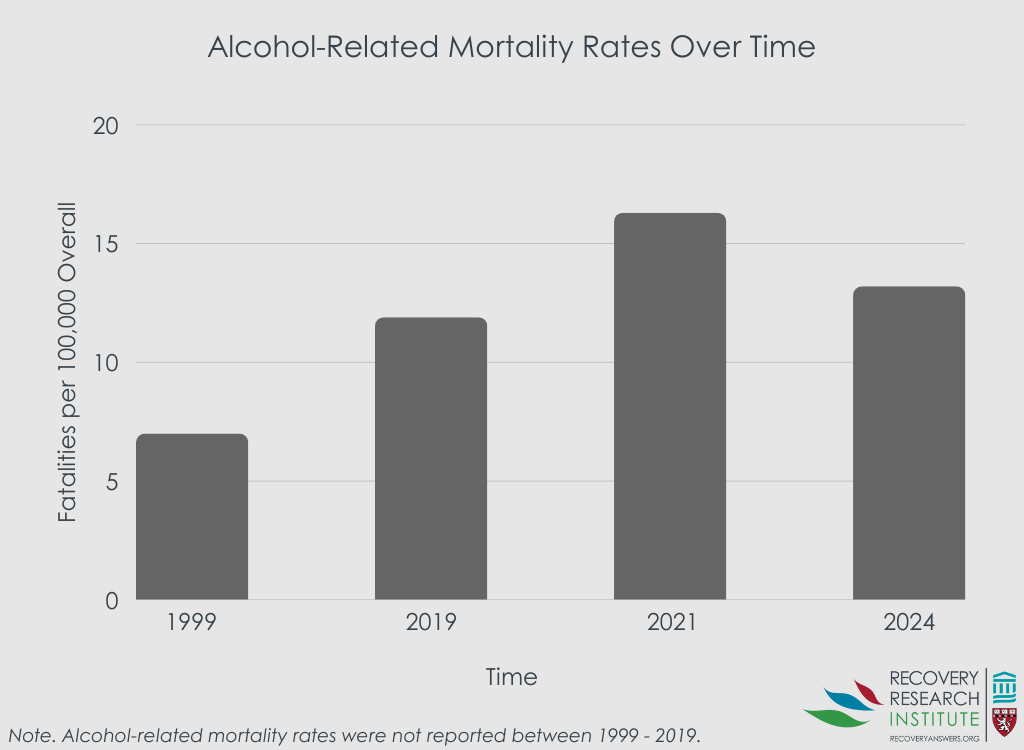
Overall, the yearly nationwide crude alcohol-related mortality rates among people of all ages increased from 7.0 in 1999 to 13.2 in 2024, which is an increase of 89%. Within this time period, mortality was the highest in 2021, with 54,258 total alcohol-related deaths. See graph below.
When examining mortality trends by sex, crude rates were always highest among men across all ages and races. In the analyses stratified by age, crude mortality rates among men were highest among those who were between the ages of 55-64 between the entire study period of 1999-2024. Among women, crude rates were also highest among this age group beginning in the mid-2010s.
When examining mortality trends by race, crude rates were highest among those of American Indian/Alaskan Native race for both men and women. Among men of this race, rates were almost 3 times that of men of other races in 1999. For example, Black men had the second-highest mortality rate in 1999, with 12.5 death per 100,000 Black men, while American Indian/Alaskan Native men had 34.4 deaths per 100,000. This trend was mirrored in 2020, with crude rates among American Indian/Alaskan men being more than 3 times that of men among other races. Similarly, the trend extended to women of American Indian/Alaskan Native race, with rates being 4 times higher than women of other races in 1999 and 5 times higher in 2020.
Alcohol-related yearly mortality rates rose more sharply more among women, those between the ages of 25-34, and those of American Indian/Alaskan Native race
Although the overall crude mortality rate for men of all ages and races was consistently higher than those among women across the study time period, rates increased at a higher level among women than men. Crude rates among women of all ages and races rose from 0.9 deaths per 100,000 women in 1999 to 4.4 deaths per 100,000 in 2021, which is when mortality peaked (at the height of the COVID-19 pandemic) and reflects an increase of 381%. This rate slightly decreased in 2024 to 3.2 deaths per 100,000 women but is still an increase of 255% from 1999.
When examining rate increases by age, men and women between the ages of 25-34 experienced the largest increases in crude mortality rates between 1999 and 2025, although rates were consistently higher among those between the ages of 55-64. Across all ages under the age of 75, mortality peaked in 2021 at the height at the COVID-19 pandemic.
When examining rate increases by race, men and women of the American Indian/Alaskan Native race had the largest increases in crude mortality rates between 1999 and 2020 as compared to all other races. Men of this race had an increase of 135% and women had an increase of 226%. Mortality rates also increased during this time period for men and women of Asian Pacific Islander and White races. However, crude mortality rates increased at a slower rate among those who were Hispanic and rates even decreased for Black men and women until the mid-2010s.
Alcohol-related mortality rates increased during the COVID-19 pandemic, with alcoholic liver disease being the main cause
Overall, the nationwide alcohol-related mortality rates among people of all ages increased from 11.9 deaths per 100,000 individuals in 2019 to 16.3 deaths in 2021, reflecting an increase of 37% (see graph above). The crude rate remained higher in 2024 than 2019, with a rate of 13.2 deaths per 100,000 individuals, reflecting an increase of 11% from 2019. This increase was slightly higher for women than men, with an increase of 39% for women compared to 36% for men between 2019 and 2021, and an increase of 16% for women vs. 8% for men between 2019 and 2024.
When examining monthly trends in mortality rates by sex and age, crude mortality rates jumped substantially for both men and women for all age groups below the age of 75 in the spring of 2020 (concurrent with the beginning of the COVID-19 pandemic). The largest increases for men were found for those between the ages 15-34 and between 35-44, with increases of 28% and 26%, respectively, from April to May 2020. For women, the largest increase was found for those between the ages 35-44, with an increase of 28% during the same months. Rates remained elevated through 2023 for both men and women of all age groups and started to decline in 2024.
When examining monthly trends by cause of death, alcoholic liver disease was found to be the main cause of death. This was followed by mental and behavioral disorders due to alcohol use. Cause of death from alcohol poisoning was relatively low and not associated with any jumps in mortality.
Alcohol-related mortality rates vary by state
Crude alcohol-related mortality rates increased for all states within the entire study period of 1999-2024. The largest rate was observed in New Mexico, followed by Alaska and Wyoming. The lowest rate was observed in Hawaii, with 3.1 deaths per 100,000 people in 1999 and 6.3 deaths per 100,000 people in 2024. This was followed by Maryland and Pennsylvania.
All states also had record high rates during the pandemic years of 2020, 2021, and 2022, with some of the highest rates recorded in 2021. Specifically, in 2021, New Mexico had 51.6 deaths per 100,000 people, Alaska had 43.0 deaths per 100,000, and South Dakota had 42.1 deaths per 100,000. When comparing 2023 crude mortality rates to 2019, all states were still at least 10% higher in 2023 than in 2019, except for Wyoming, New Jersey, Hawaii, and Vermont, whose 2023 rates were slightly lower than their 2019 rates. However, rate decreases were observed by 2024, when the 10% increase remained for approximately half of the states.
WHAT ARE THE IMPLICATIONS OF THE STUDY FINDINGS?
The research team examined differences in alcohol-related mortality rates by demographics across time between 1999-2024 and whether the record high rate increases observed during the COVID-19 pandemic persisted or returned to pre-pandemic levels. Key findings include: (1) alcohol-related mortality rates have increased by 89% between 1999-2024, with substantial peaks during the pandemic years that persisted for approximately 4 years and have begun returning to pre-pandemic levels in 2024; (2) while alcohol-related mortality rates were consistently highest among men, rates rose most sharply among women during the study period; (3) the age group with consistent high rates during the study period was 55-64, yet rates rose most sharply among those aged 25-34; (4) the racial group with both consistent high rates and the sharpest increase was those of American Indian/Alaskan Native race; and (5) the state with the highest alcohol-related mortality rate was New Mexico.
It should be noted that deaths for which alcohol is only partially a cause or deaths due to chronic diseases related to alcohol use (e.g., certain cancers or cardiovascular disease), but for which alcohol was not the primary cause of death, were excluded. This may have resulted in an underestimation of alcohol-related mortality rates. Even despite this, the finding that alcohol-related mortality rates have increased by 89% since 1999, coupled with prior research showing that alcohol-related mortality has been rising over the past 2 decades, highlights the critical need for prevention and intervention efforts to address excessive alcohol consumption. Although rates have recently begun to return to pre-pandemic levels, those levels were still higher than those observed in 1999. To reduce excessive alcohol use and save lives from alcohol-related deaths, a multi-pronged approach is needed that includes the implementation of evidence-based prevention programs that aim to reduce risk factors and enhance protective factors across the life span along with evidence-based treatment and recovery programs.
The study was conducted using mortality data from the US. Results may not generalize to other countries, especially countries with stricter or more lenient alcohol policies.
Deaths for which alcohol is only partially a cause or deaths due to chronic diseases related to alcohol use (e.g., certain cancers or cardiovascular disease), but for which alcohol was not the primary cause of death, were excluded. This may have resulted to an underestimation of mortality rates.
Data was pulled from the CDC WONDER database, which does not include categories for which there are fewer than 10 deaths. Accordingly, data is not available for combinations of gender, age, or race categories since their rates were extremely low.
Only provisional data was available for 2024 at the time of the study and has since been updated. However, these updates were minor and did not impact the study’s conclusions.
BOTTOM LINE
Alcohol-related mortality rates have increased substantially since 1999 across all demographic groups, with a sharp increase during the COVID-19 pandemic. Notably, rises were sharpest among women and those between the ages of 25-34. Rates were both consistently high and rose the most sharply among those of American Indian/Alaskan Native race. These findings highlight the need for better prevention and intervention efforts overall and among these groups in particular.
For individuals and families seeking recovery: These trends in alcohol-related mortality underscore that alcohol-related harm is a growing concern across all groups, and that seeking help early is increasingly important. Families and individuals who recognize that alcohol-related risks are rising among younger adults and women, and seek supportive, evidence-based resources for prevention and recovery for these groups, may reduce mortality rates and improve public health outcomes.
For treatment professionals and treatment systems: Treatment professionals who are aware of changing demographic patterns in alcohol-related mortality and adapt outreach and care models for high-risk groups may reduce mortality rates and improve public health outcomes. Expanding culturally responsive services, gender-informed interventions, and screening in younger populations may help prevent escalation and reduce deaths.
For scientists: Researchers have an opportunity to investigate the underlying drivers of these demographic shifts, including social, economic, and biological factors. Identifying mechanisms and evaluating targeted prevention and treatment strategies will be critical to informing more equitable public health responses. Additionally, future research that includes mortality that is partially attributable to alcohol use would shed light on demographic differences in deaths for which alcohol is a contributing factor and not the primary cause. Finally, research that investigates alcohol-related mortality rates in other countries would help us understand how stricter or more lenient alcohol cultures affect mortality.
For policy makers: Policymakers who use these findings to support policies that prioritize alcohol prevention and treatment initiatives that are inclusive and tailored to the populations most affected can help reduce alcohol-related mortality and improve public health outcomes. Investment in public health infrastructure, culturally grounded interventions, and data-driven monitoring systems can help reverse these trends and save lives.
Previous studies, however, often did not analyze differences in alcohol-related mortality rates by demographics, such as age, sex, race, and geographic location. It is also unclear whether the record high-rate increases observed during the pandemic have persisted or returned to pre-pandemic levels. Researchers in this study examined demographic differences in the number of deaths from alcohol across time, including trends during and after the pandemic. Such research can help identify which demographic groups are at the highest risk of alcohol-related death and whether particular groups continue to be affected by pandemic-related rate increases, which can help target prevention and intervention efforts towards these individuals.
HOW WAS THIS STUDY CONDUCTED?
The researchers in this study examined demographic differences in the number of fully attributable alcohol-related deaths in the United States between 1999 and 2024. Demographic differences that were investigated included age, sex, race, and geographic location.
Mortality data was obtained from the Centers for Disease Control and Prevention’s Wide-Ranging Online Data for Epidemiologic Research (CDC WONDER) database. Data was pulled for deaths of individuals from all 50 states in US and the District of Columbia of all ages between 1999 and 2024. The research team identified deaths attributable to alcohol using codes from the International Statistical Classification of Diseases and Related Health Problems, Tenth Revision (ICD-10). The codes included were related to alcoholic liver disease, alcohol poisoning, and mental and behavioral disorders due to the use of alcohol. Only alcohol-related deaths that were fully attributable to alcohol use were included because deaths that are partially linked to alcohol use may include other confounding factors that the researchers wanted to avoid.
Demographic data was also based on the data pulled from the CDC WONDER database. In this database, sex is treated as a binary variable (i.e., male and female) and the researchers accordingly adopted this classification in their analyses. A complicated process was used to determine the racial categorization, but ultimately the research team followed the categorization provided by the CDC WONDER database and extracted the racial information from death certificates. The following racial categories were used: American Indian and Alaskan Native, Asian and Pacific Islander, Black, Hispanic, and White. For age, the researchers used 10-year age groups, starting at age 15 and ending at age 75 and older. Data on race was only available from 1999-2020, while data for all other demographic variables was available from 1999-2024. Thus, alcohol-related mortality was not examined after the COVID-19 pandemic, which began in March 2020.
For the analyses, the researchers used population data to calculate crude mortality rates, stratified by sex, age, race, and 3 cause-of-death categories: alcoholic liver disease, mental and behavioral disorders due to alcohol use, and alcohol poisoning. Crude rates were calculated by dividing the number of fatalities in each year or month by the associated total population in that given year or month, multiplied by 100,000 – thus, resulting in number of deaths per 100,000 people. Trends in alcohol-related mortality rates over time were analyzed.
WHAT DID THIS STUDY FIND?
Alcohol-related yearly mortality rates increased nationwide – men, middle-aged adults, and American Indian/Alaska Natives had the largest overall rates
Overall, the yearly nationwide crude alcohol-related mortality rates among people of all ages increased from 7.0 in 1999 to 13.2 in 2024, which is an increase of 89%. Within this time period, mortality was the highest in 2021, with 54,258 total alcohol-related deaths. See graph below.
When examining mortality trends by sex, crude rates were always highest among men across all ages and races. In the analyses stratified by age, crude mortality rates among men were highest among those who were between the ages of 55-64 between the entire study period of 1999-2024. Among women, crude rates were also highest among this age group beginning in the mid-2010s.
When examining mortality trends by race, crude rates were highest among those of American Indian/Alaskan Native race for both men and women. Among men of this race, rates were almost 3 times that of men of other races in 1999. For example, Black men had the second-highest mortality rate in 1999, with 12.5 death per 100,000 Black men, while American Indian/Alaskan Native men had 34.4 deaths per 100,000. This trend was mirrored in 2020, with crude rates among American Indian/Alaskan men being more than 3 times that of men among other races. Similarly, the trend extended to women of American Indian/Alaskan Native race, with rates being 4 times higher than women of other races in 1999 and 5 times higher in 2020.
Alcohol-related yearly mortality rates rose more sharply more among women, those between the ages of 25-34, and those of American Indian/Alaskan Native race
Although the overall crude mortality rate for men of all ages and races was consistently higher than those among women across the study time period, rates increased at a higher level among women than men. Crude rates among women of all ages and races rose from 0.9 deaths per 100,000 women in 1999 to 4.4 deaths per 100,000 in 2021, which is when mortality peaked (at the height of the COVID-19 pandemic) and reflects an increase of 381%. This rate slightly decreased in 2024 to 3.2 deaths per 100,000 women but is still an increase of 255% from 1999.
When examining rate increases by age, men and women between the ages of 25-34 experienced the largest increases in crude mortality rates between 1999 and 2025, although rates were consistently higher among those between the ages of 55-64. Across all ages under the age of 75, mortality peaked in 2021 at the height at the COVID-19 pandemic.
When examining rate increases by race, men and women of the American Indian/Alaskan Native race had the largest increases in crude mortality rates between 1999 and 2020 as compared to all other races. Men of this race had an increase of 135% and women had an increase of 226%. Mortality rates also increased during this time period for men and women of Asian Pacific Islander and White races. However, crude mortality rates increased at a slower rate among those who were Hispanic and rates even decreased for Black men and women until the mid-2010s.
Alcohol-related mortality rates increased during the COVID-19 pandemic, with alcoholic liver disease being the main cause
Overall, the nationwide alcohol-related mortality rates among people of all ages increased from 11.9 deaths per 100,000 individuals in 2019 to 16.3 deaths in 2021, reflecting an increase of 37% (see graph above). The crude rate remained higher in 2024 than 2019, with a rate of 13.2 deaths per 100,000 individuals, reflecting an increase of 11% from 2019. This increase was slightly higher for women than men, with an increase of 39% for women compared to 36% for men between 2019 and 2021, and an increase of 16% for women vs. 8% for men between 2019 and 2024.
When examining monthly trends in mortality rates by sex and age, crude mortality rates jumped substantially for both men and women for all age groups below the age of 75 in the spring of 2020 (concurrent with the beginning of the COVID-19 pandemic). The largest increases for men were found for those between the ages 15-34 and between 35-44, with increases of 28% and 26%, respectively, from April to May 2020. For women, the largest increase was found for those between the ages 35-44, with an increase of 28% during the same months. Rates remained elevated through 2023 for both men and women of all age groups and started to decline in 2024.
When examining monthly trends by cause of death, alcoholic liver disease was found to be the main cause of death. This was followed by mental and behavioral disorders due to alcohol use. Cause of death from alcohol poisoning was relatively low and not associated with any jumps in mortality.
Alcohol-related mortality rates vary by state
Crude alcohol-related mortality rates increased for all states within the entire study period of 1999-2024. The largest rate was observed in New Mexico, followed by Alaska and Wyoming. The lowest rate was observed in Hawaii, with 3.1 deaths per 100,000 people in 1999 and 6.3 deaths per 100,000 people in 2024. This was followed by Maryland and Pennsylvania.
All states also had record high rates during the pandemic years of 2020, 2021, and 2022, with some of the highest rates recorded in 2021. Specifically, in 2021, New Mexico had 51.6 deaths per 100,000 people, Alaska had 43.0 deaths per 100,000, and South Dakota had 42.1 deaths per 100,000. When comparing 2023 crude mortality rates to 2019, all states were still at least 10% higher in 2023 than in 2019, except for Wyoming, New Jersey, Hawaii, and Vermont, whose 2023 rates were slightly lower than their 2019 rates. However, rate decreases were observed by 2024, when the 10% increase remained for approximately half of the states.
WHAT ARE THE IMPLICATIONS OF THE STUDY FINDINGS?
The research team examined differences in alcohol-related mortality rates by demographics across time between 1999-2024 and whether the record high rate increases observed during the COVID-19 pandemic persisted or returned to pre-pandemic levels. Key findings include: (1) alcohol-related mortality rates have increased by 89% between 1999-2024, with substantial peaks during the pandemic years that persisted for approximately 4 years and have begun returning to pre-pandemic levels in 2024; (2) while alcohol-related mortality rates were consistently highest among men, rates rose most sharply among women during the study period; (3) the age group with consistent high rates during the study period was 55-64, yet rates rose most sharply among those aged 25-34; (4) the racial group with both consistent high rates and the sharpest increase was those of American Indian/Alaskan Native race; and (5) the state with the highest alcohol-related mortality rate was New Mexico.
It should be noted that deaths for which alcohol is only partially a cause or deaths due to chronic diseases related to alcohol use (e.g., certain cancers or cardiovascular disease), but for which alcohol was not the primary cause of death, were excluded. This may have resulted in an underestimation of alcohol-related mortality rates. Even despite this, the finding that alcohol-related mortality rates have increased by 89% since 1999, coupled with prior research showing that alcohol-related mortality has been rising over the past 2 decades, highlights the critical need for prevention and intervention efforts to address excessive alcohol consumption. Although rates have recently begun to return to pre-pandemic levels, those levels were still higher than those observed in 1999. To reduce excessive alcohol use and save lives from alcohol-related deaths, a multi-pronged approach is needed that includes the implementation of evidence-based prevention programs that aim to reduce risk factors and enhance protective factors across the life span along with evidence-based treatment and recovery programs.
The study was conducted using mortality data from the US. Results may not generalize to other countries, especially countries with stricter or more lenient alcohol policies.
Deaths for which alcohol is only partially a cause or deaths due to chronic diseases related to alcohol use (e.g., certain cancers or cardiovascular disease), but for which alcohol was not the primary cause of death, were excluded. This may have resulted to an underestimation of mortality rates.
Data was pulled from the CDC WONDER database, which does not include categories for which there are fewer than 10 deaths. Accordingly, data is not available for combinations of gender, age, or race categories since their rates were extremely low.
Only provisional data was available for 2024 at the time of the study and has since been updated. However, these updates were minor and did not impact the study’s conclusions.
BOTTOM LINE
Alcohol-related mortality rates have increased substantially since 1999 across all demographic groups, with a sharp increase during the COVID-19 pandemic. Notably, rises were sharpest among women and those between the ages of 25-34. Rates were both consistently high and rose the most sharply among those of American Indian/Alaskan Native race. These findings highlight the need for better prevention and intervention efforts overall and among these groups in particular.
For individuals and families seeking recovery: These trends in alcohol-related mortality underscore that alcohol-related harm is a growing concern across all groups, and that seeking help early is increasingly important. Families and individuals who recognize that alcohol-related risks are rising among younger adults and women, and seek supportive, evidence-based resources for prevention and recovery for these groups, may reduce mortality rates and improve public health outcomes.
For treatment professionals and treatment systems: Treatment professionals who are aware of changing demographic patterns in alcohol-related mortality and adapt outreach and care models for high-risk groups may reduce mortality rates and improve public health outcomes. Expanding culturally responsive services, gender-informed interventions, and screening in younger populations may help prevent escalation and reduce deaths.
For scientists: Researchers have an opportunity to investigate the underlying drivers of these demographic shifts, including social, economic, and biological factors. Identifying mechanisms and evaluating targeted prevention and treatment strategies will be critical to informing more equitable public health responses. Additionally, future research that includes mortality that is partially attributable to alcohol use would shed light on demographic differences in deaths for which alcohol is a contributing factor and not the primary cause. Finally, research that investigates alcohol-related mortality rates in other countries would help us understand how stricter or more lenient alcohol cultures affect mortality.
For policy makers: Policymakers who use these findings to support policies that prioritize alcohol prevention and treatment initiatives that are inclusive and tailored to the populations most affected can help reduce alcohol-related mortality and improve public health outcomes. Investment in public health infrastructure, culturally grounded interventions, and data-driven monitoring systems can help reverse these trends and save lives.